Reports
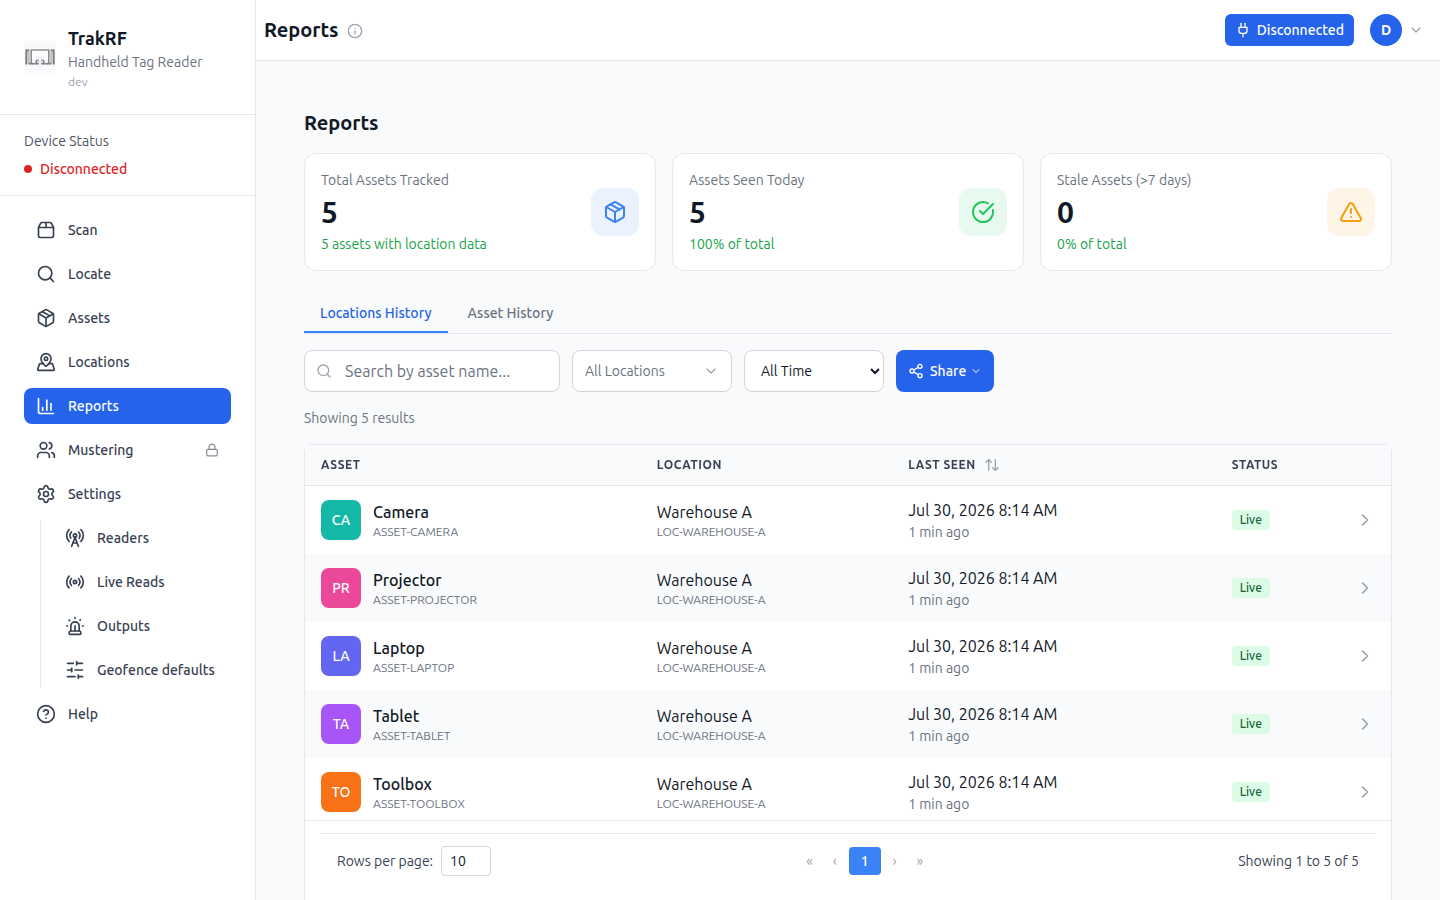
Desktop
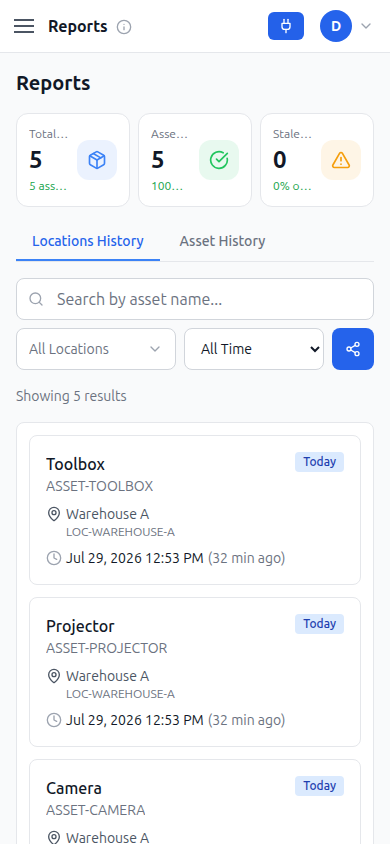
Mobile
What this page does
Reports summarizes asset movement over time. Headline stat cards show Total Assets Tracked, Assets Seen Today, and Stale Assets (>7 days) — note that "Total Assets Tracked" counts only assets with location/scan history, which can be lower than the full roster on the Assets page. Two tabs switch the view: Locations History (default) lists recent asset/location/last-seen rows with a search-by-name field, an "All Locations" filter, and a time-range dropdown (All Time by default); Asset History instead asks you to pick one asset from a dropdown plus a From/To date range, then shows "Select an Asset — Choose an asset from the dropdown above to view its movement history" until you do. A fresh workspace with no scans shows "No Location Data — No assets have been scanned yet. Assets will appear here once they are detected by RFID readers."
How it fits in the app
Reports is the read-only analytics surface for data that Scan and Locate produce. Use it after a Scan sweep to confirm assets were seen recently, or to spot stale records before doing a reconcile run. Export via the Share button alongside the filters.